Is Bitcoin entering a new bear market or is there a long-term buying opportunity coming soon?
 We live in exciting times if you are into Bitcoin technical analysis. On the daily chart we see a death cross predicting a major short-term drop in price. On the weekly chart we see a golden cross indicating a long-term buying opportunity. What do we make of this and how will these crosses help me buy Bitcoin at the right time?
What is Technical Analysis?
Technical analysis or TA uses statistical analysis of past price movements to predict the probabilities of future price movements. Cryptocurrency markets are primarily driven by greed and fear and this increases the reliability of technical analysis. Humans act in predictable emotional patterns again and again particularly visible on these unregulated markets. Technical analysis is basically the study of market psychology and crowd behavior.
Death Cross, the price will go down!
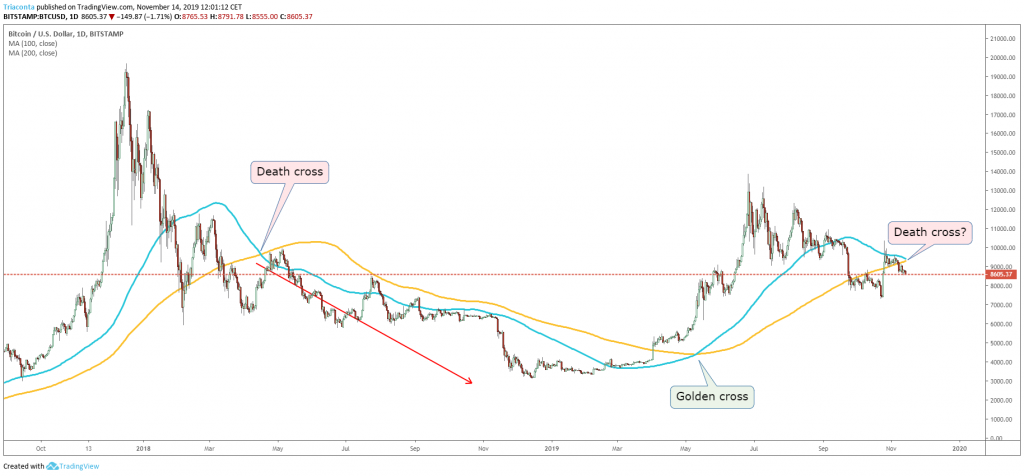
A death cross occurs when a short-term moving average crosses a long-term moving average downwards. It is believed to be an early indicator of a down-trend or bear market. The trendlines are usually based on the average of the previous 50, 100 or 200 daily or weekly prices. In the chart above you see that around November 17, Bitcoin will most likely experience a death cross of the 100 day and 200 day moving averages. This signals the start of a down-trend or bear market just like it did in April of 2018. Based on this indicator the Bitcoin price will go down in the next few months.
Golden Cross, the price will go up!
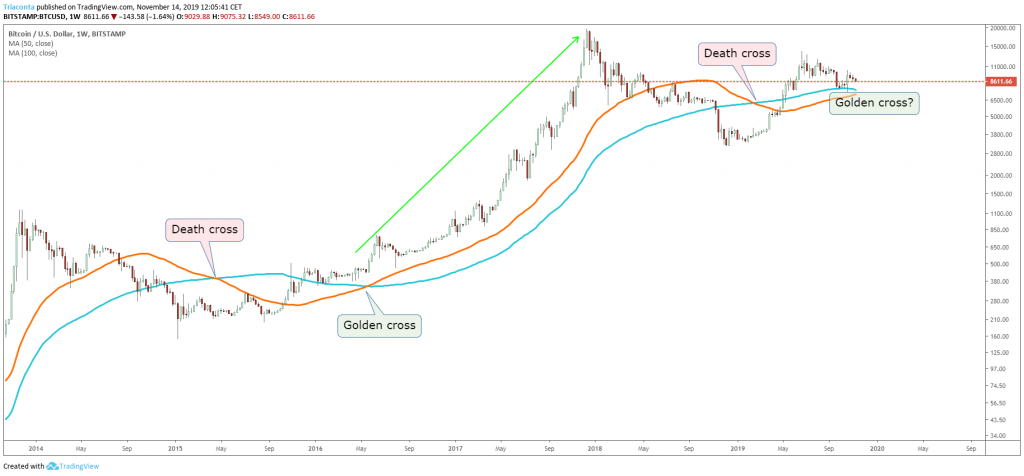
A golden cross is the exact opposite. It occurs when a short-term moving average crosses a long-term moving average upwards. It signals the start of a long-term uptrend or bull market. The chart above is logarithmic and shows the 50 week and 100 week moving averages. It looks like the market is repeating what happened between 2014 and 2017. Bitcoin reaches an all time high and drops significantly causing a death cross and a rounded bottom. The price then corrects upwards and the uptrend is confirmed by a golden cross and starts a long-term bull market. A golden cross is possible in early December and predicts a long-term rise to a new all time high for Bitcoin.
Instant profit and 100 percent accuracy?
Technical analysis (TA) is not an exact science. There is no system, signal or pattern that works 100% of the time. Indicators can only determine that a certain event (e.g major price drop) has a bigger chance of occurring than other events (e.g. major price rise, stable price). Moving averages are a popular technical indicator and golden or death crosses often make headlines. If many people believe a prediction and buy or sell the cryptocurrency accordingly this makes the prediction itself come true. And most people will not care if the prediction is a self fulfilling prophecy. There are many different technical indicators and the above are examples of just one. All trading strategies suggested below are to be used at your own risk.
How to buy Bitcoin at the right time
Crosses are more likely to predict the upcoming trend if the price moves near the cross. We are currently below the possible death cross and above the possible golden cross. This means that if the price would rise to around $9350 on November 17 the death cross would signal a downtrend and lower prices for the next few months. If the price does not rise but instead drops further down to around $7425 in early December the golden cross signals an excellent buying opportunity and prices are expected to start rising until the Bitcoin halving in May 2020.